Cities like New York, San Francisco and Washington, D.C., are commonly referred to as "superstar cities" - centers of innovation that are home to major companies in sectors like defense, finance and technology. Companies in these cities pay top dollar to attract talent from all over the country and the world, thus contributing to a sky-high cost of living that is often well above what the average American can afford.
The total cost of living ranges from 18% to 28% above average in these cities. Housing can be particularly unaffordable, with rents costing at least 50% more on average.
Living in a big city and benefiting from the concentration of jobs, amenities and culture, however, doesn't have to be risky. There are dozens of cities across the country with a below-average cost of living and relatively affordable real estate markets - and many of them are growing fast.
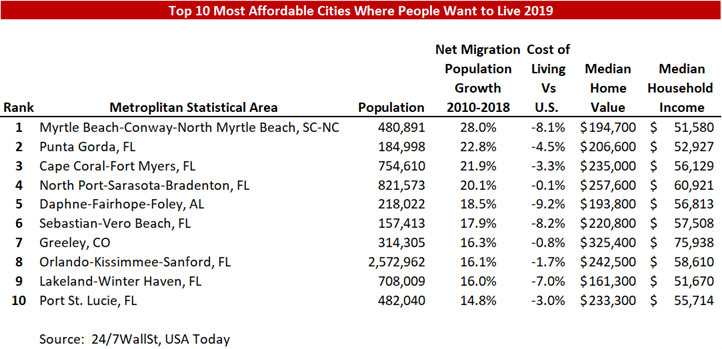
Using data from the US Census Bureau and the Bureau of Economic Analysis, 24/7 Wall Street has identified the 50 most affordable metropolitan areas that Americans are moving to. In each of the metropolitan areas on this list, the total cost of living is lower than the national average and typical housing costs are more in line with the area's income than the average across all cities. In addition, between 2010 and 2018, many more people moved to these cities than the rest.
Not only are people moving to these cities, but many are also choosing to start families in these areas. Around half of the cities on this list also reported above-average natural population growth - meaning that there were more births than deaths between 2010 and 2018.

Methodology
To identify the cheapest cities in America, where everyone wants to live, 24/7 Wall Street considered three factors:
- Cost of living;
- Housing prices; and
- Population growth from migration.
Of the 383 metropolitan areas in the US, only those with regional price parity - or cost of living - below the national average were considered. Metropolitan areas also needed to have a housing affordability ratio - median home value divided by median annual household income - below the average ratio across all metropolitan areas of 4.46. Finally, the 50 metropolitan areas were ranked by the highest population growth due to net migration between 2010 and 2018.
Median household income and median home values are from the US Census Bureau's 2018 American Community Survey. Population estimates and population changes between 2010 and 2018, as of July 1, 2018, are from the Census Bureau's Population Estimates Program. Regional price parity, or cost of living, is from the Bureau of Economic Analysis.
The percentage rankings of median household income and median home value are provided for context and were calculated based on all 383 U.S. metropolitan areas.
